

Turn flood depths into kroner at risk, then rank adaptation options by how much damage risk each investment removes.
The big idea
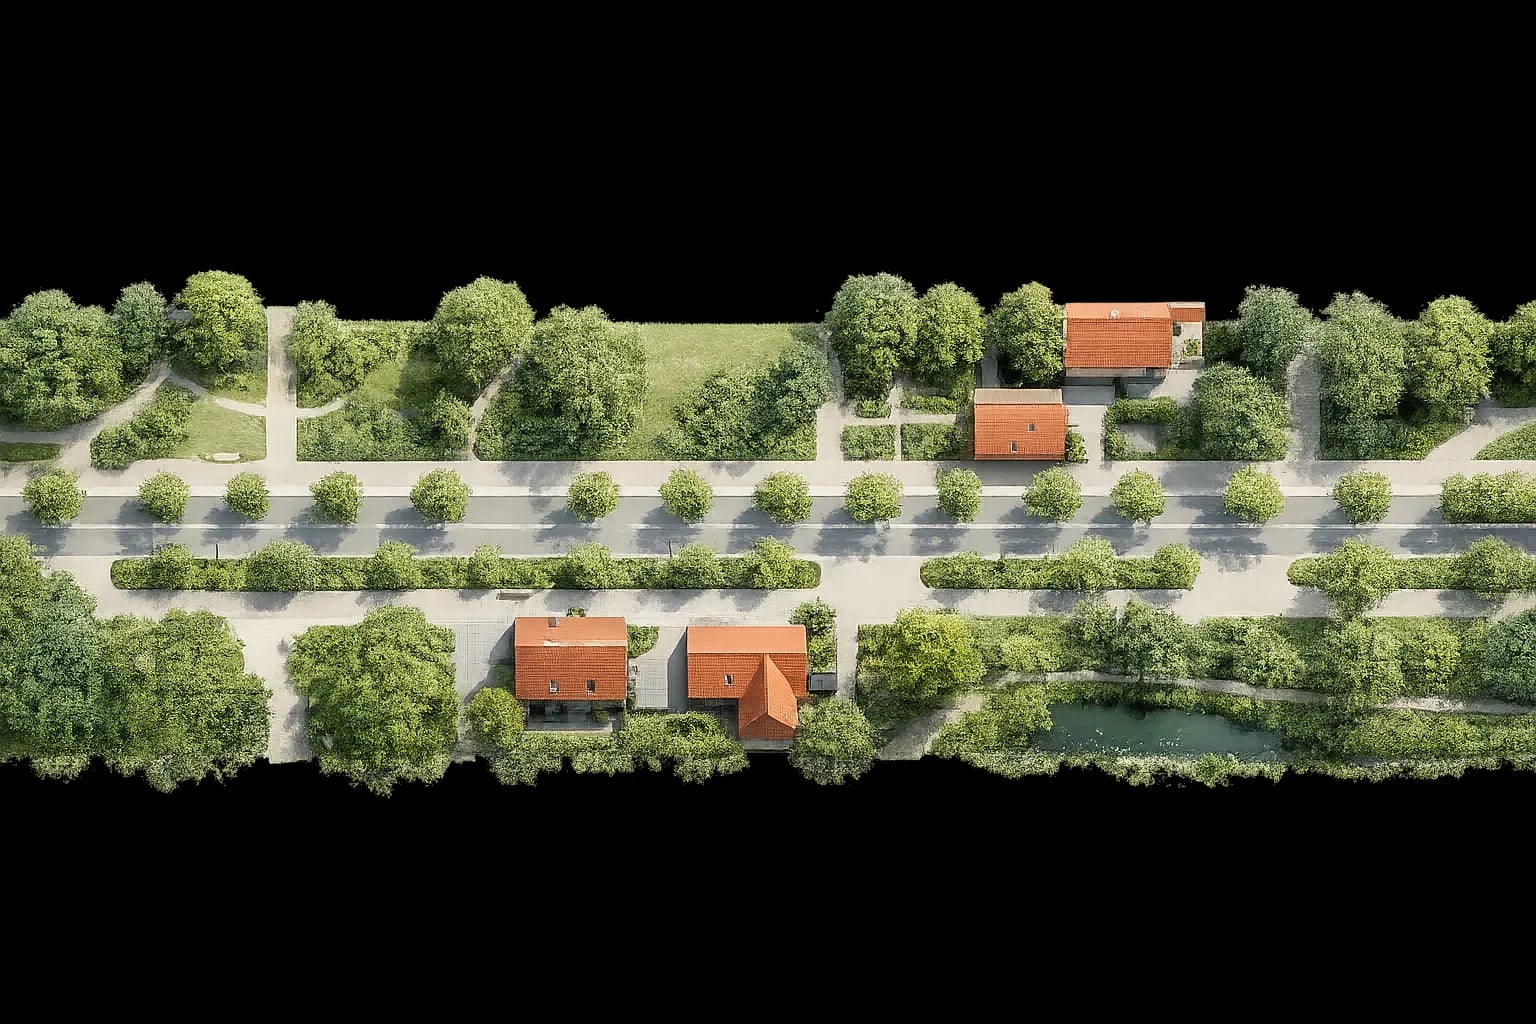
Svendborg used an open-source damage calculator to price flood risk and prioritize harbour climate adaptation investments.
Turn flood depths into kroner at risk, then rank adaptation options by how much damage risk each investment removes.

Svendborg’s coastal location makes the municipality vulnerable to sea level rise, cloudbursts and heavy rain. The harbour area is particularly important because major values could be lost during climate-related flooding. The municipality needed a detailed basis for planning and prioritizing adaptation, with a focus on getting the greatest climate protection for the money.
Svendborg used an open-source damage calculator to connect flood scenarios, local asset data and economic loss estimates. The plan was to create a transparent basis for comparing adaptation investments by their risk reduction per krone spent.
Step 1
Clarify what the damage calculator should support and where choices between adaptation measures are needed.
Step 2
Install the open-source tool and gather terrain, asset and external data, including data from SDFI platforms.
Step 3
Model flood scenarios such as 5-, 10-, 20-, 50- and 100-year events and translate floodwater into expected losses.
Step 4
Compare adaptation scenarios by expected risk reduction and implementation cost to identify the best value options.
Step 5
Present results in accessible graphics and text for political decision-making and dialogue with citizens.
33%
Damage risk reduction from the chosen harbour strategy.
DKK 17m
Annual harbour-area damage risk before adaptation.
DKK 5.6m
Annual damage risk reduction from the first strategy phase.
DKK 11.4m
Annual damage risk after the planned first phase.
The selected first part of the harbour strategy reduces annual damage risk by DKK 5.6 million, equal to a 33% reduction. Svendborg also developed two additional scenarios that could reduce annual risk by DKK 13.1 million or DKK 16.3 million. The work required about one full-time equivalent year for the overall project.
Key lesson: flood adaptation becomes easier to prioritize when water levels are translated into expected economic damage. The tool is useful for political decisions and public dialogue, but cities must be transparent about data, assumptions and definitions.
Explore additional presentations that complement this one

A shared data platform helps Danish municipalities build comparable greenhouse gas inventories and climate action plans.
Read more
A 2019 synthesis on how cities can mainstream nature-based solutions for climate adaptation through co-produced knowledge, indicators, and finance.
Read more
Aarhus used GPS data and FleetOptimiser AI to right-size home-care vehicles before new leases, cutting cars, costs and CO2.
Read more

